CWP Market Insights – November 2024
Authored by Chris Vidler, CFP®, CIMA®, RICP®, CLU®
As Fall is upon us and we enter a season of change, we have begun to shift our focus to what lies ahead for markets in 2025. The Federal Reserve too has begun its own season of change in September as they started off their rate cutting cycle by reducing the federal funds rate by 50 basis points. Almost immediately, we began to see an impact within less volatile assets such as money market funds and CDs.
Money market funds, where investors park cash for short-term gains, hold a massive $6.3 trillion₁—nearly double the amount pre-pandemic. These funds have grown due to the Federal Reserve raising short-term interest rates to 5%. Based on the Fed’s current rate cutting projections, we could see yields on these funds drop to around 2-3% by next summer.
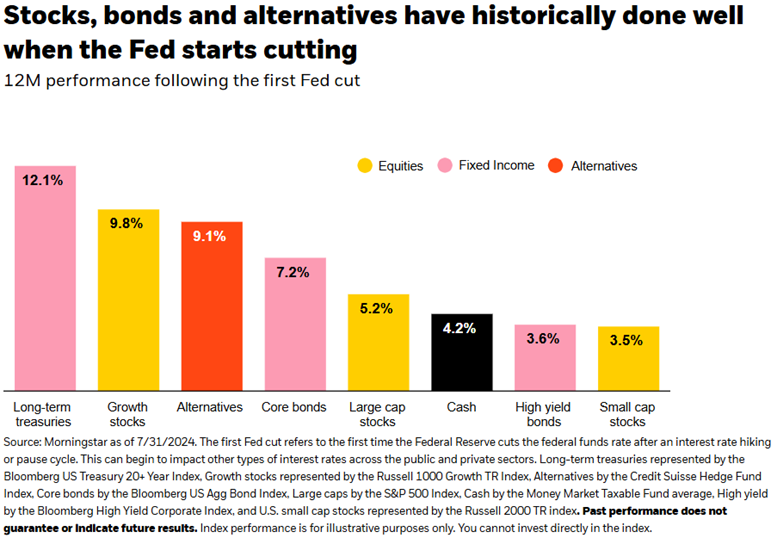
The good news? Most assets have historically done well when the Fed starts cutting interest rates. As is frequently the case, staying invested may be the most important decision that you can make in this environment.

Since this chart was released just 2 months ago, it seems as though everything is indeed up if not at all-time highs. The US stock market as represented by the S&P 500 has never been higher, recently surpassing 6,000. The Dow Jones has gone from roughly 6,500 in March of 2009 to nearly 44,000.
Gold is at all-time highs, which is rare to see the precious metal rising at the same time as stocks.
Housing prices are at all-time highs, despite near 7% mortgage rates.
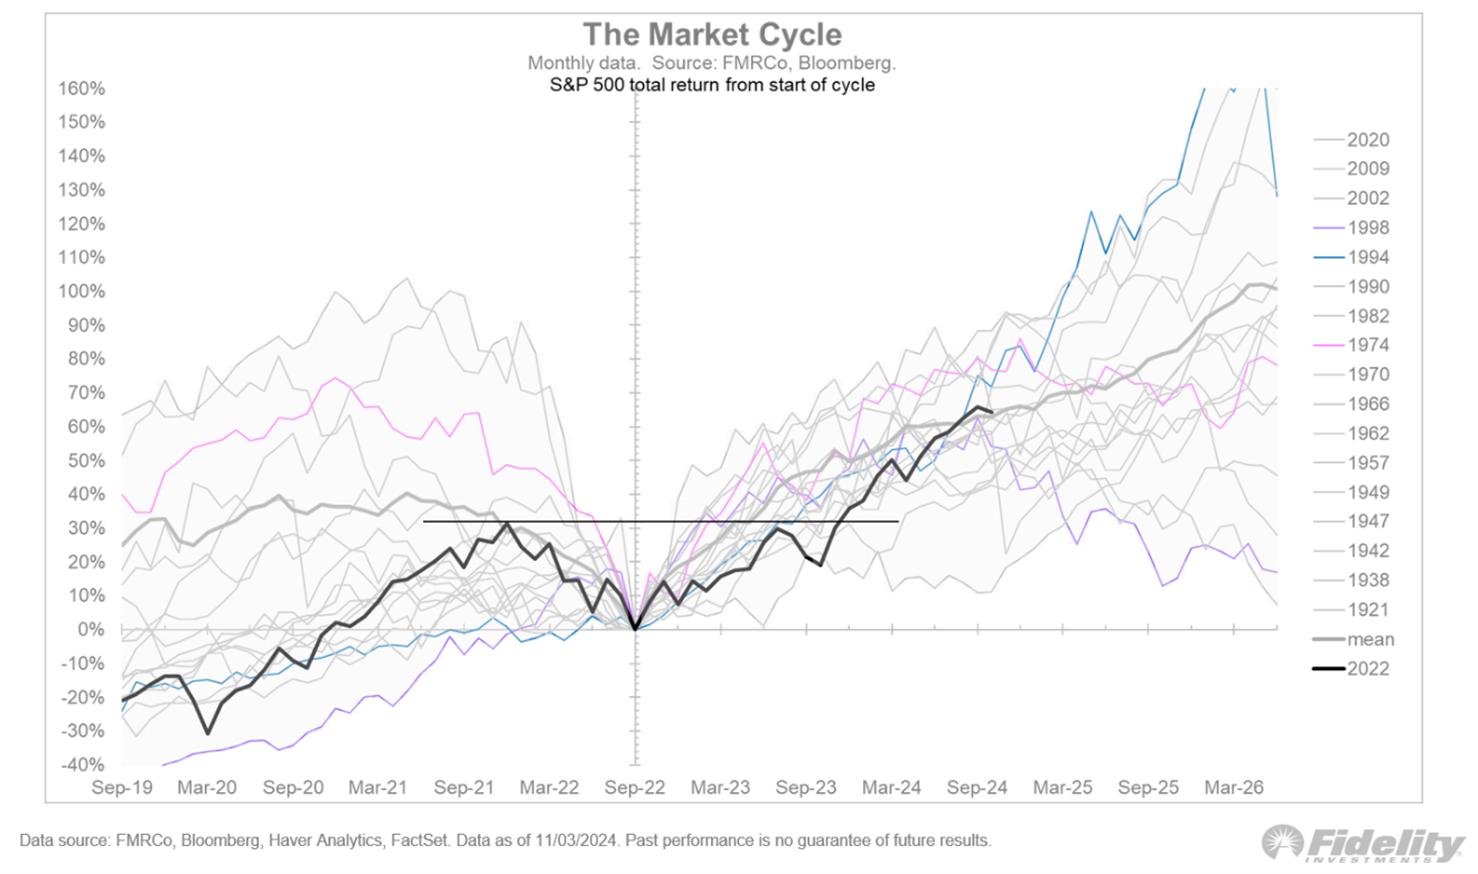
The logical question is what could possibly be next? While predictions are hard if not impossible, the good news is it appears that this bull market is actually right on schedule.
The following chart shows the current bull market cycle in BLACK mapped against historical bull market cycles. As you can see, at 25 months old this bull market is right within historical bull market ranges, and could have more room to go.

Moving into the end of the year, we watchfully favor growth in our portfolios. While this market has been extremely resilient, we cannot dismiss signs that areas of the economy may be slowing, and that inflation may prove to be stickier than the Fed would like. Because of this, we continue to underweight US Small Cap stocks in favor of Large to Mid cap stocks with a Quality bias. From a sector perspective, we currently favor Health Care for its defensive properties and Tech plus Financials for growth.
For a more in depth look at markets including the impact of Tariffs, we encourage you to take a look at Raymond James’s Investment Strategy Quarterly publication.
₁ Source: Investment Company Institute as of 9/4/2024. www.ici.org
The opinions expressed are those of Christopher Vidler and Eric Van Der Hyde as of the date stated and are subject to change. There is no guarantee that the forecasts made will come to pass. This material does not constitute investment advice and is not intended as an endorsement of any specific investment or security. Information and opinions are derived from proprietary and non-proprietary sources. Options are not necessarily those of Raymond James.
Please remember that all investments carry some level of risk, including the potential loss of principal invested. Diversification and strategic asset allocation do not assure profit or protect against loss.
The S&P 500 is an unmanaged index of 500 widely held stocks that is generally considered representative of the U.S. stock market. Keep in mind that individuals cannot invest directly in any index, and index performance does not include transaction costs or other fees, which will affect actual investment performance. Individual investor's results will vary.
The Dow Jones Industrial Average (DJIA), commonly known as “The Dow” is an index representing 30 stocks of companies maintained and reviewed by the editors of the Wall Street Journal. The Bloomberg US Treasury 20+ Year Total Return Index measures the performance of US Treasury securities with a maturity of more than 20 years. The Russell 1000 Growth Total Return index is a benchmark that tracks the performance of large-cap growth stocks in the US. It's a subset of the Russell 1000 Index, and is made up of companies with higher price-to-book ratios, higher forecasted growth, and higher historical sales per share growth. The Bloomberg US Aggregate Bond Index is a broad-based flagship benchmark that measures the investment grade, US dollar-denominated, fixed-rate taxable bond market. The Bloomberg U.S. Corporate High Yield Bond Index is composed of fixed-rate, publicly issued, non-investment grade debt, with dividends reinvested. The Russell 2000 TR Index is a stock market index that tracks the performance of the 2,000 smallest companies in the Russell 3000 TR Index, based on market capitalization.


